Child Population Density and Soil Contamination in Pierce County
Click to expand

The Process

-
A point feature class was created to symbolize XY coordinates of soil sample data with concentrations of both lead and arsenic.

-
Two new feature classes were exported from the merged samples feature class: one for arsenic samples and one for lead samples. For both feature classes, the Dissolve tool was used to aggregate concentration values of multiple samples taken at the same location into one mean value per data point.
-
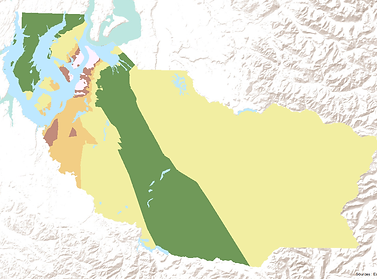
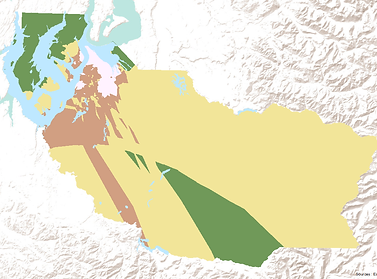
The Kriging method was used to interpolate the concentrations of lead and arsenic between sample points. The result of this analysis appears in the top left image for arsenic and the bottom left image for lead. These rasters were then reclassified using the standard deviation of the concentration of arsenic (top right) or lead (bottom right).

-
U.S. Census data on the number of children age 10 and under per block group was added to a Pierce County block group polygon. The density of children per block group was calculated by dividing the number of children per block group by the size of the block group (square miles) (left).
-
The density of children per block group was symbolized as points using the Feature to Point tool (right).


-
The Inverse Distance Weighted interpolation method was used to create a continuous surface showing the density of children in Pierce County (left). The raster was reclassified using the standard deviation (right).

-
Finally, the Raster Calculator tool was used to create a surface showing the combined density of young children, concentration of lead, and concentration of arsenic.