Service Area Analyses for Residential Treatment Centers, WIC Centers, and EMS Centers in Tacoma, Washington
This map shows the results of a service area analysis for emergency medial stations (EMS) in Tacoma, where the red dots represent EMS facilities. Data for Pierce County roads were clipped to the Tacoma city limits. Road data, including speed limit, was used to determine which areas of Tacoma could be reached within 1, 5, and 10 minute drives from each EMS facility. Light red polygons represent areas that may be reached within 1 minute, orange represents the areas that may be reached within 5 minutes, and yellow represents areas that may be reached within 10 minutes.
This map shows the results of a service area analysis for Women, Infant, and Children (WIC) retailers in Tacoma, where the purple dots represent WIC retailers. Data for Pierce County roads were clipped to the Tacoma city limits. Road data was used to determine which areas of Tacoma are within a 1, 5, and 10 minute walk to each WIC retailer assuming a 3 mile-per-hour walking pace. The darkest purple represents areas that are within a 1 minute walking distance and the lightest purple represents areas that are within a 10 minute walking distance.
The analysis used walk time, rather than drive time, to represent service areas around WIC retailers because these facilities serve low-income women who may not have access to a car or funds for public transportation. One potential flaw in creating walking service areas using the network dataset that we did is that the dataset contains road data, but no sidewalk data. It is possible that some streets do not have pedestrian access.
This map shows the results of a Network Analysis, which was used to calculate the most effective driving route between 22 WIC retailers in Tacoma. The analysis used driving time as the cost factor to determine the most time-efficient route, since the route is for produce delivery. The route begins at the WIC retailer with a label of 1 and ends with the WIC retailer with a label of 22.


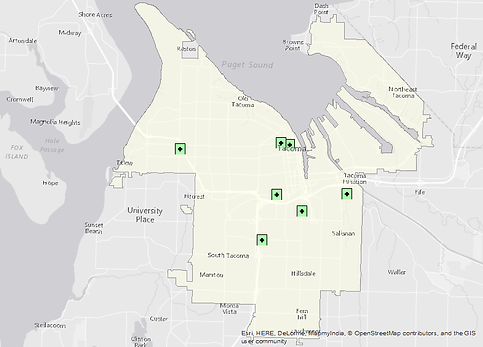

Figure 1
Figure 2
Additional Analyses
Introduction
The purpose of this analysis was to determine which single-family homes in the City of Tacoma are within 5, 10, and 15-minute walking distances from Residential Treatment Centers. I hypothesized that Residential Treatment Centers tend to be located in lower-value neighborhoods. To determine whether this hypothesis is true I examined the taxable values of single-family homes within each of these walking ranges.
Residential Treatment Center Locations and Home Values
Method
To determine which single-family homes are located within 5, 10, and 15-minutes of each Residential Treatment Center (Figure 1) I performed a service area analysis using Tacoma streets data and computing walk time toward each facility using an average walking pace of 3 miles per hour and 5, 10, and 15-minute distances (Figure 2). I then selected all single-family homes from Tacoma tax parcels (Figure 3) and used the Statistics tool to determine the number of homes and their mean taxable values in each walking-distance range.
Results
The mean value of single-family homes within a 15-minute walking distance of residential treatment facilities decreases the closer the homes are to the facility. Figure 4 shows the number and value of homes located within and outside of each of the walking distance areas.
Conclusion
The results of this analysis support my hypothesis that Residential Treatment Centers tend to be in lower-value neighborhoods.
Figure 3
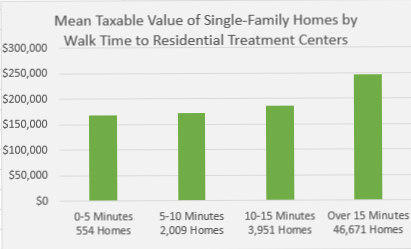
Figure 4