Tacoma's Social Landscape: 3D Representation of Child Density and Income by Neighborhood
The interpolated raster of median household income by block group (Figure 3) was created in ArcScene to visualize median income by neighborhood. The exaggeration was adjusted by a Z value of about 0.6 to make the peaks and valleys less severe. The results of this analysis appear in Figure 7. Roads are symbolized by grey lines and neighborhoods are delineated by black lines.
Figure 2
Figure 3
The purpose of this analysis was to visualize median household income and child density by neighborhood in Tacoma, Washington. Figure 1 shows the seven neighborhoods of Tacoma, for reference in the rest of the maps resulting from these analyses.
Figure 4
3D: Average Income per Block Group, by Neighborhood
3D: Density of Children Under Age 10 per Block, by Neighborhood


Figure 5


Income & Child Density Interpolation
Figure 1
In the first part of the analysis, Tacoma block group polygons were converted to points (Figure 2). Then, the points were interpolated using Inverse Distance Weighted based on median household income per block group (Figure 3).
Pierce block centroids were clipped to the Tacoma boundary (Figure 4). Then, the points were interpolated using Inverse Distance Weighted based on the density of children under the age of 10 (Figure 5).
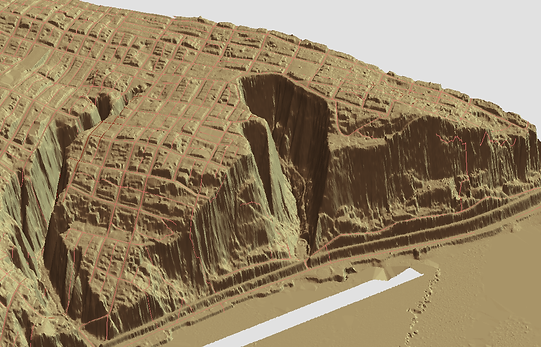
Figure 6
In ArcScene, a Tacoma Hillshade and Tacoma street data were layered to create a 3D representation of Old Town, in the North End neighborhood. The base height for both the hillshade and streets was set to actual elevation data for Tacoma. The vertical dimensions were then exaggerated by selecting 'Calculate from Extent.' The resulting map appears in Figure 6.
Figure 7
Figure 8
The interpolated raster of density by block (Figure 5) was created in ArcScene to visualize child density by neighborhood. The exaggeration was adjusted by a Z value of about 0.5 to make the peaks and valleys less severe. The results of this analysis appear in Figure 8. Roads are symbolized by grey lines and neighborhoods are delineated by black lines.


